What is Data Visualization? 10 Ways It Benefits Your Business
In this data-driven world, Data is the most crucial thing for the business to make or break. And the businesses generate massive amounts of data every day. The large data is hidden with many valuable insights that help businesses identify the patterns and make well-informed strategic decisions that drive business growth.
Raw data is indeed difficult to analyze because of its natural state. To make this more convenient and easy, Data visualization a powerful tool comes into play. It converts complex data into understandable graphs, and visuals, that are easily analyzed, and allows businesses to extract valuable insights quickly.
Understanding Data Visualization
Data Visualization is usually the graphical or visual representation of data that helps the organization understand the information in the raw data.
It has the ability to transform complex data sets into visual interpretations such as graphs, charts, maps, and dashboards, that way it will be easier for data analysis and data interpretation.
Role of Data Visualisation Specialist
A data visualisation specialist possesses certain skills to design and create the visualisations making sure that they effectively provide insights to the target audience.
A data visualization specialist is a professional who develops and creates visual representations of data, ensuring that the visuals are not only visually appealing but also successful in expressing the intended message.
Outstanding Benefits of Data Visualization
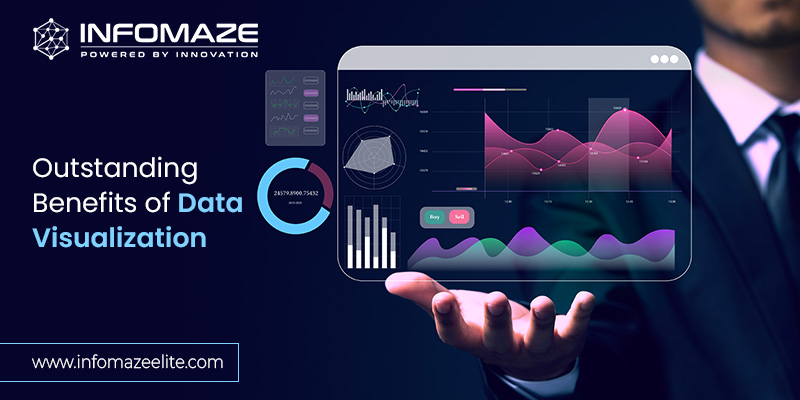
Data Visualization is a pack of many advantages. Some of them are as follows:
Enhanced Decision-Making
Data visualization provides quicker and more informed decision-making. When decision-makers see data trends and correlations at a glance, they can make strategic choices with confidence.
Communication of Insights
Understanding complex data and communicating with others is quite difficult. Thus, data visualization provides an understanding Infographic view of data, making it easier to communicate with the team, stakeholders, customers, etc.
Improved Data Understanding
Data visualization makes data easier to understand. Instead of sifting through rows and columns of numbers, individuals can quickly grasp key trends, patterns, and outliers in the data through visualizations.
Identifying Patterns and Trends
Data Visualization helps you to identify the Visualizing and understanding the data is to set your business on the path that leads to success.
Real-time Monitoring
Businesses can monitor key metrics and performance indicators through the real-time capabilities of data visualization allowing them to adapt to frequent market changes.
Simplified Reporting
Traditional reports with plenty of figures and text might be confusing. Data visualizations present data in a user-friendly way, so that is understandable and easily accessible.
Increased Cooperation
Visuals are more understanding and interactive than raw data and easily hold your audience’s attention. Whether you’re giving an internal presentation or making a sales pitch to a client, data visualizations may increase the impact of your message.
Customer Understanding
With data visualization, you can provide customized solutions for the clients satisfying their requirements, by analyzing customer needs and specifications.
Competitive Growth
Data Visualization tools are skillfully designed such that they enable the business to adapt to the latest trends and stay updated to be one step ahead of the competition.
Best Data Visualization Tools
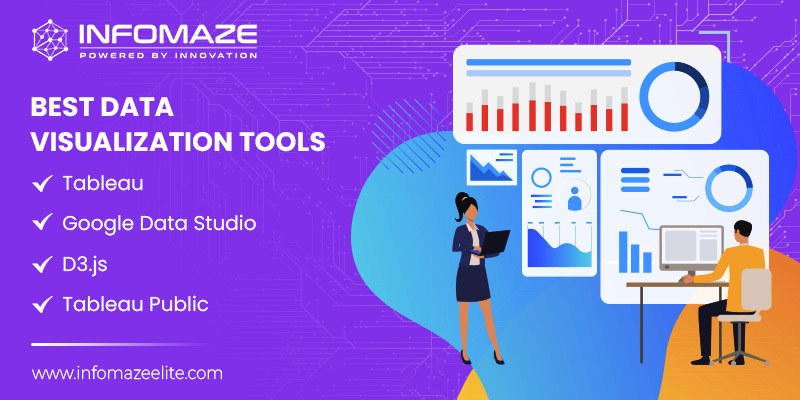
Here are some of the best data visualization tools:
Tableau:
A popular choice for creating interactive and shareable dashboards.
Google Data Studio:
A free tool for creating custom reports and dashboards using data from various sources.
D3.js:
A JavaScript library for creating custom, interactive data visualizations.
Tableau Public:
A free version of Tableau for creating and sharing visualizations publicly.
Whether you are a startup or a huge enterprise, Data visualization can simplify your data with its outstanding benefits and help you stay competitive in today’s dynamic business race irrespective of size.
Looking to boost your business productivity with your raw data? You are at the right place! Infomaze is here to provide you with expert data solutions by our dedicated team. Our skilled solutions simplify complex data and make well-informed decisions to enhance better understanding and communication.
Visualizing and understanding the data is to set your business on the path that leads to success. Get in touch with us!
Categories
- AI/ML (6)
- Application Migration (8)
- BI (7)
- Case Study (28)
- CRM (8)
- Dot Net (8)
- Informational Blog (71)
- IT Help Desk (8)
- Mern Stack (1)
- Microsoft 365 (2)
- Mobile Application (9)
- Offshore Development (10)
- Outsourcing Services (1)
- PHP (11)
- PowerBI (7)
- QuickBooks (6)
- ReactJS (4)
- SEO (14)
- SharePoint (3)
- Web Application (10)
- Xero (1)
- Zoho (15)
- Zoho Case Study (38)



Disclaimer: All rights belong to the owner. No Copyright or Trademark Infringement Intended.

