Create Dynamic Power BI Dashboard to Make the Best Use of Your Data
Infomaze specializes in data analytics using Power BI and helps companies improve their profitability by promoting optimal use of data. As certified BI consultants, we use Power BI dashboards to track our own sales and marketing metrics.
Modern day entrepreneurs face several challenges while operating day-to-day business development with very little insight into their data. However, we assist such business owners by creating robust Microsoft Power BI dashboards that in turn makes the best use of their raw data, just the way they want to see it.
Power BI Importance
A Power BI dashboard is built on SaaS (Software as a Service) model and majorly focuses on predictive modeling and reporting. Dashboards built on Power BI display KPI (Key Performance Indicators) from data that resides both on-premises and in the cloud and delivers insights throughout your organization.
Just like most businesses are the most focused on building their business, they totally overlook the fact that their business needs a strategic plan too. Hence, we’re constantly trying to come up with better ways to track sales conversions.
A dashboard created with Power BI lucidly demonstrates the progress of your business with major sales and marketing initiatives. Not just that, it can easily filter and drill-down to see what caused a downfall or even a win in that case.

With the help of Power BI dashboard you can evaluate:
- Daily/monthly sales conversations with prospective and existing clients.
- Opportunity pipeline showing which prospects have the potential to close a deal and where they are in the purchasing process.
- Key marketing initiatives.
- Individual sales person dashboard that measures the conversion rate.
- Sales team’s success.
Power BI Case Studies
We have built customized analytics dashboard with real-time, beautiful representation of analytics for our customers; due to which they’re able to view metrics such as conversions and pageviews. Given below are three case studies of Microsoft Power BI projects we previously worked on.
Power BI Solution for a Car Dealership Company
Situation: Infomaze built a Power BI dashboard for a car dealership company. The client was precisely looking for an interactive dashboard to demonstrate business metrics in real-time. They were looking for a live dashboard that would showcase sales KPI (Key Performance Indicator) and customer feedback in a graphical format.
Challenges: The company’s operations heavily relied on paper-based data and manual interaction; therefore failing to understand the reasons behind the downfall of sales or even profits in that matter. They lacked an automated data visualization tool that would allow them to monitor KPIs to drive growth.
Solution: Our team deliberately built a smart Power BI dashboard to perfectly fit the client’s needs.
With our dashboard, the customer could assess:
- Sales KPIs of Daily/monthly conversions and customer touches.
- Customer feedback about their service.
- Total profits.
- Patterns and trends in marketing campaigns.
The automated Power BI dashboard that we built, allowed the client to take informed decisions and shortly improved the productivity and agility of their business.
Power BI Solution for a Restaurant Chain
Situation: We have helped a restaurant chain by developing a sleek BI dashboard. They were specifically looking for an enhanced dashboard for insights on KPIs, inventory management and team scheduling.
Challenges: Their data was scattered across multiple systems and lacked a real-time dashboard to help them with data collection, data cleansing and data modeling. Since they lacked a live BI dashboard, their executives were facing challenges in driving sales and tracking inventory.
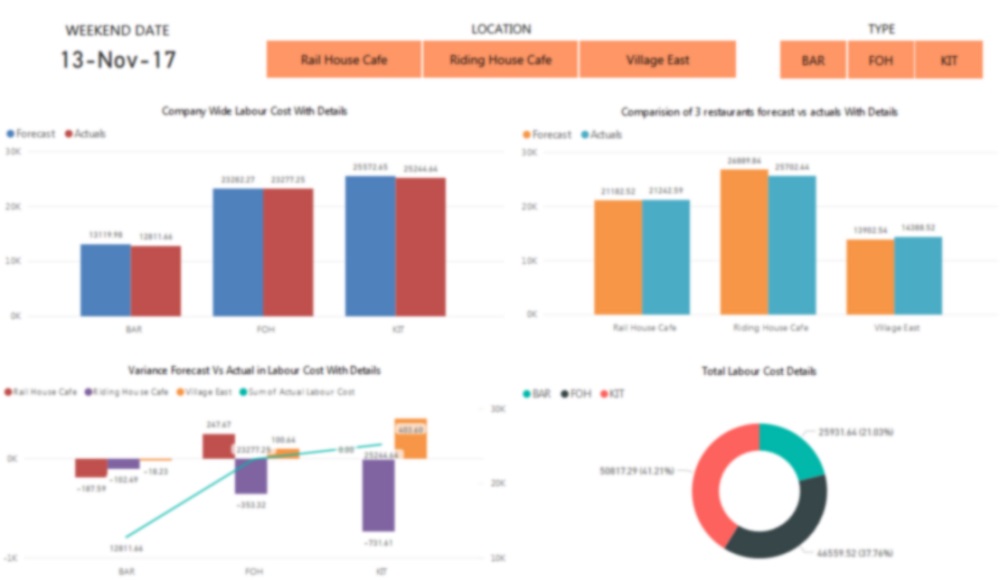
Solution: We developed a Power BI dashboard that allowed them to obtain their latest insights irrespective of their location.
The dashboard developed by us helped the client to:
- Detect high-achievers and under-performers through the KPIs for each user’s dashboard.
- Track inventory usage.
- Manage tasks.
- Audit trails.
This turned out to be a massive breakthrough for the client as the Power BI dashboard developed by us allowed the client to outperform their competitors. Hire best Power BI developer India!
Power BI Solution for a Delivery Company
Situation:
A leading delivery company was looking for an enhanced dashboard to track their data. Infomaze helped them by creating a customized dashboard to track courier services and forecast business profits.Challenges:
The company was struggling with business management as they did not have an enhanced dashboard and failed to get insights on activities within their organization.Solution:
As certified Power BI consultants, we developed a comprehensive dashboard that helped the logistic company to view their overall performance, identify strengths and bottlenecks, and efficiently plan future business strategies.With Power BI, the client is now able to visualize meaningful insights quickly and easily, thus leading to faster & better decision making.
How Infomaze can help?
Infomaze as a company, is a business solution provider; we understand your business queries and develop solutions accordingly. Being one of the most renowned BI developers India, we build highly interactive, modern dashboards to suit your requirement. Our highly capable team comprises of data visualization specialists that create business solutions tailored to fit your needs.
An enhanced dashboard in place can help you make informed decisions about marketing and sales strategies, so you can completely focus on profitable activities only.
You will no longer have the need to assemble data through multiple sources, only for the end result to look vaguer. Instead, you can access your company data in just a few clicks. It couldn’t get simpler right?
Try us now!Categories
- AI/ML (6)
- Application Migration (8)
- BI (7)
- Case Study (28)
- CRM (8)
- Dot Net (8)
- Informational Blog (71)
- IT Help Desk (8)
- Mern Stack (1)
- Microsoft 365 (2)
- Mobile Application (9)
- Offshore Development (10)
- Outsourcing Services (1)
- PHP (11)
- PowerBI (7)
- QuickBooks (6)
- ReactJS (4)
- SEO (14)
- SharePoint (3)
- Web Application (10)
- Xero (1)
- Zoho (15)
- Zoho Case Study (38)



Disclaimer: All rights belong to the owner. No Copyright or Trademark Infringement Intended.

