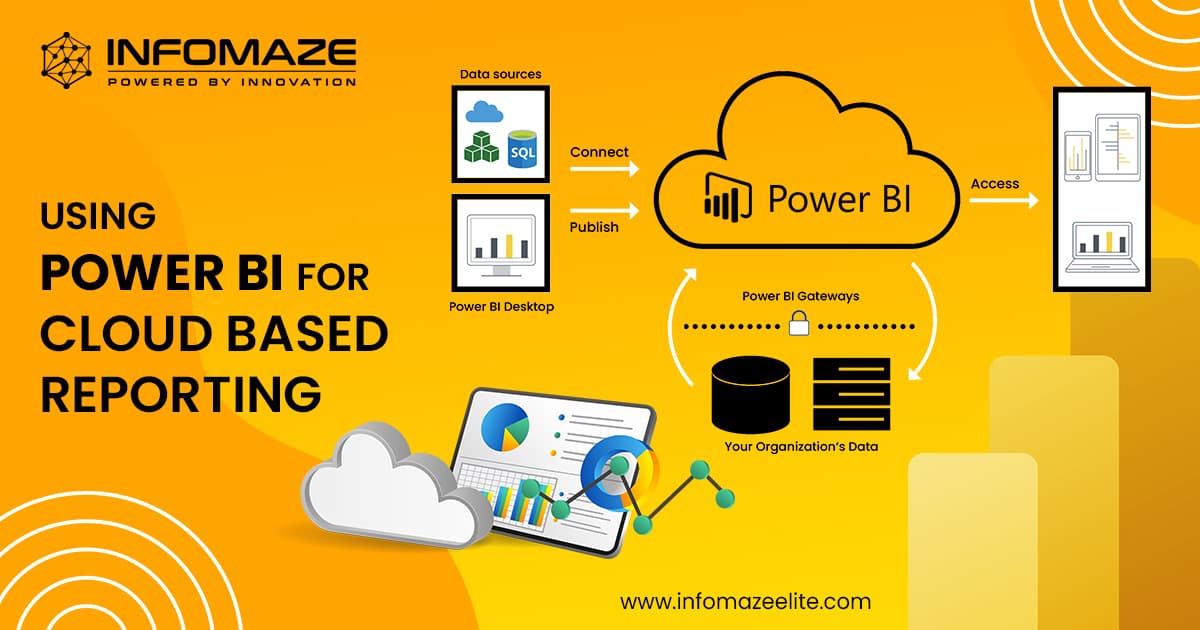
Advanced Power BI Development Techniques: Tips and Tricks
Organizations that wish to make educated decisions in today’s data-driven environment must embrace the possibilities of data analytics. Microsoft Power BI, a renowned business intelligence tool, has emerged as the preferred option for many enterprises.
But, as with any sophisticated technology, Power BI’s capabilities are only as good as the person using it. To become a true Power BI expert, you must grasp sophisticated programming approaches as well as data visualization and analysis tips and tricks.
Let’s explore more about Power BI and learn the tips and tricks for Advanced Power BI development.
Power BI Development
Power BI has revolutionized data analytics and business intelligence. It enables businesses to transform raw data into useful insights. While getting started with Power BI is very simple, learning advanced approaches may significantly improve the quality and impact of your reports and dashboards.
Listed below are some of the important techniques you should consider fo advanced power BI development.
Data Modeling
One of the fundamental aspects of Power BI development is data modeling. Proper data modeling guarantees that your data is formatted in such a way that you may create complicated, interactive reports.
Consider the following techniques:
Star Schema :
Implement a star schema model to create efficient relationships between tables, enhancing report performance and simplifying the process of building DAX calculations.
Row-Level Security (RLS) :
Apply RLS to control access to specific data for different users or user groups, ensuring that sensitive information remains confidential.
Advanced Security
The security of data is critical. Advanced Power BI developers understand how to build role-level security, and row-level security, and manage user access inside reports. They ensure that only authorized users get access to sensitive data.
Advance Data Visualizations
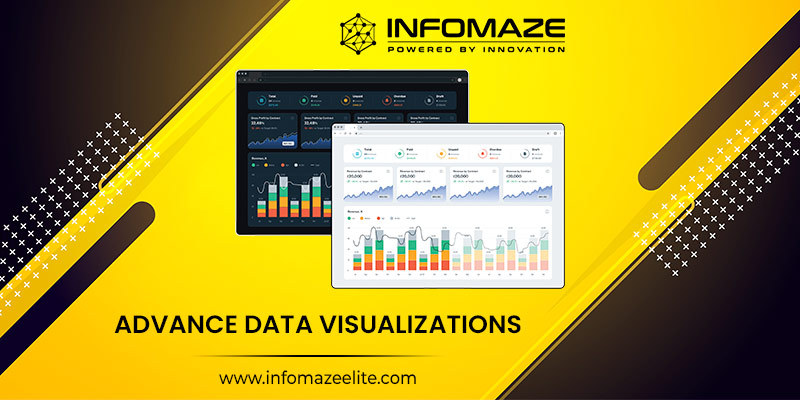
Pay attention to the following to make your reports aesthetically appealing and informative:
Drill-Through :
Implement drill-through capabilities to allow users to dig deeper into data. This function is beneficial to those who want to look into specific data points.
Tooltips :
Tooltips can help you give context to your images. Make your tooltips that show useful information when users hover over data points.
Advanced Themes :
With sophisticated themes, you may change the style and feel of your reports. Custom themes in Power BI can be created to meet your organization’s branding and design criteria.
Custom Visuals and Integrations
While Power BI has several built-in visualizations, occasionally more customized images are required to properly convey your message. Here’s how to use this method:
Customized Visuals :
To add distinctive, eye-catching components to your reports, explore the world of custom visuals, such as those available on the Power BI marketplace.
Scripts in R or Python: :
To generate complex visualizations or statistical analysis directly within Power BI, use R or Python scripts.
API Integration :
Power BI APIs enable developers to integrate Power BI reports and dashboards into custom applications. Understanding how to use these APIs can be game-changing for businesses, allowing them to effortlessly combine their data analytics solutions with current systems and applications.
DAX Expressions
Power BI’s formula language for creating custom computations and aggregations is Data Analysis Expressions (DAX). Here are some DAX tips to help you improve your Power BI reports:
Functions of Time Intelligence :
To execute complicated time-based computations, such as year-to-date (YTD) comparisons and moving averages, use time intelligence functions such as TOTALYTD, SAMEPERIODLASTYEAR, and DATESYTD.
Tables of Parameters :
Make parameter tables so that users can update certain values in a report, such as date ranges or KPI targets, without having to edit the report itself.
Performance Enhancement
It is critical to optimize the efficiency of your Power BI reports, especially when dealing with enormous datasets. To improve report timeliness, use techniques such as data aggregation, query folding, and computed tables. This is a necessary ability for producing effective and user-friendly reports.
Aggregations :
To precompute and save summary data, use aggregated tables. This has the potential to greatly enhance query performance, particularly for complex calculations.
Live Connections and DirectQuery :
Consider using DirectQuery or Live Connections when dealing with huge datasets to maintain your data in its source and lessen the burden on Power BI’s data engine.
Power BI Service Collaboration

The cloud-based platform for sharing and collaborating on Power BI reports is known as Power BI Service. Use the following approaches to improve collaboration:
Power BI Apps :
Create and publish Power BI Apps to provide end users with a streamlined experience and to simply update and manage reports in the Power BI Service.
Publish to Web :
Using the “Publish to Web” option, you may share your reports with non-Power BI users by embedding them in websites or blogs.
Automation and PowerShell
A Power BI expert’s ability to automate mundane processes is a distinguishing feature. Learn how to use PowerShell scripting to automate deployment, data refresh, and other administrative activities. Not only can automation save time, but it also maintains consistency in your Power BI development process.
Advanced-Data Transformation
In Power BI, Power Query is a sophisticated ETL (Extract, Transform, Load) tool. You should learn the M language, which is the backbone of Power Query if you want to become an expert.
To clean and shape your data for optimal analysis, learn to develop custom functions and execute complex data transformations.
Sometimes the data you work with needs a little extra attention before it can be successfully represented. These methods can help you save time and effort:
Custom Power Query Functions :
In Power Query, create custom functions to automate data transformation processes and make them reusable across many datasets.
Language M :
Dive further into the M programming language, on which Power Query is based, to develop customized transformations for complicated data sets.
Use custom functions in M code to encapsulate complex data transformations, resulting in more modular and maintainable queries.
You may improve your data analysis and visualization capabilities by applying these advanced Power BI development strategies.
These tips and techniques will help you get the most out of Power BI’s rich features and functions, whether you’re creating interactive dashboards, sharing insights with your team, or constructing entire business intelligence solutions.
Custom visuals provided by Infomaze can be a valuable addition to your set of tools for using Power BI, providing increased visualization possibilities as well as a variety of solutions to elevate your reports and dashboards.
When you combine these advanced methodologies with Infomaze’s unique visualizations, you’ll be well on your way to developing data-driven insights that will help your organization make better decisions.
Categories
- AI/ML (6)
- Application Migration (8)
- BI (7)
- Case Study (28)
- CRM (8)
- Dot Net (8)
- Informational Blog (71)
- IT Help Desk (8)
- Mern Stack (1)
- Microsoft 365 (2)
- Mobile Application (9)
- Offshore Development (10)
- Outsourcing Services (1)
- PHP (11)
- PowerBI (7)
- QuickBooks (6)
- ReactJS (4)
- SEO (14)
- SharePoint (3)
- Web Application (10)
- Xero (1)
- Zoho (15)
- Zoho Case Study (38)




Disclaimer: All rights belong to the owner. No Copyright or Trademark Infringement Intended.


